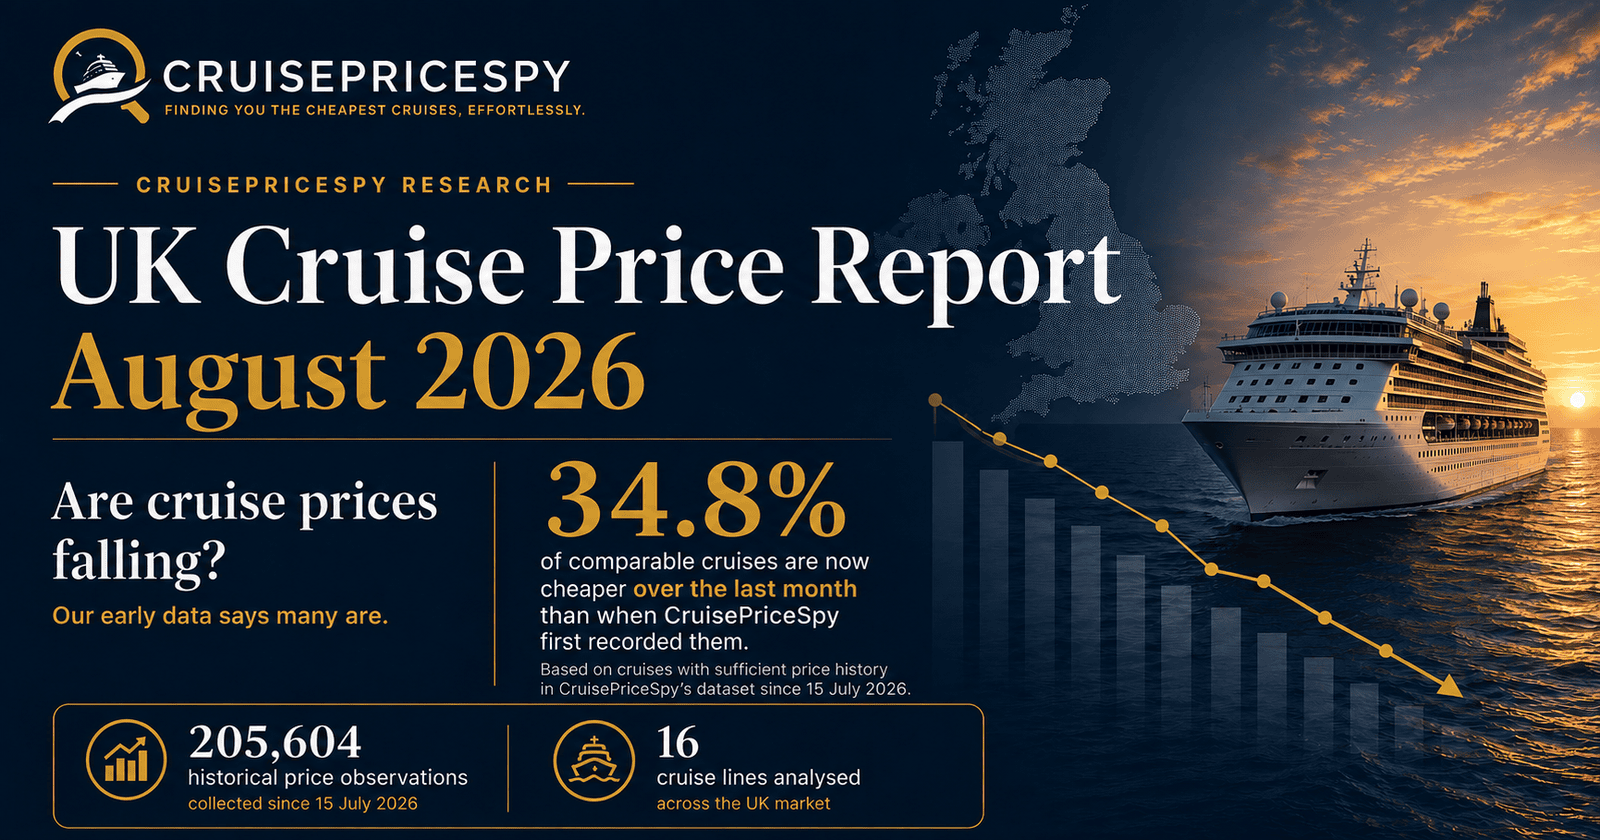
UK Cruise Price Report – August 2026
What 205,604 historical cruise price observations reveal about fare movements, reductions, cabin pricing and booking patterns.
Cruises
currently monitored
Cruise lines
tracked
Historical price
records
Currently below
first recorded price
Are UK cruise prices falling?
Not across the board. CruisePriceSpy’s August 2026 analysis found that 4,595 cruises, or 34.8% of comparable actively tracked cruises, were priced below the first price recorded by CruisePriceSpy.
Among those reductions, the median fall was 3.4% and the average fall was 6.2%. The largest individual reduction recorded was 67.8%.
But look at individual cabin prices rather than whole cruises, and more have risen than fallen: 36.9% of comparable cabin prices increased against 23.8% that decreased, with the remaining 39.3% unchanged. The two figures aren’t a contradiction — a single cruise can have one cabin category falling while another rises — see “Why this differs” below. The honest summary: cruise pricing this period was mixed, not a uniform trend in either direction.
The analysis is based on CruisePriceSpy’s daily tracking of 13,303 active cruises across 16 cruise lines, using 205,604 historical price observations collected since 15 July 2026.
The headline finding
Among the cruise lines tracked by CruisePriceSpy, Virgin Voyages currently has the highest proportion of tracked cruises below their first-recorded price among the 16 cruise lines tracked. 56.8%. Cunard, however, records the deepest typical reductions, with a 11.4% median drop when prices fall.
The findings below are based on CruisePriceSpy’s live historical pricing dataset, updated 15 August 2026 — except the departure-month and reduction-duration sections further down (marked accordingly), which reflect the dataset as at 13 August 2026 pending a methodology re-check.
UK Cruise Price Report – August 2026
Our first UK cruise pricing analysis examines how often cruise fares fall, which cruise lines are seeing the most reductions, and what current price movements reveal.
Cruises tracked
Price observations
Below first recorded price
Key numbers
Of 13,211 actively tracked cruises with sufficient history to compare, 4,595 are currently below their first-recorded price.
Which cruise lines currently have the most cruises below their first-recorded price?
The proportion of tracked cruises currently below their first-recorded price varies sharply by cruise line.
| Cruise line | Below first-recorded price | Share reduced |
|---|---|---|
| Virgin Voyages | 412 / 725 | 56.8% |
| Disney Cruise Line | — | 48.2% |
| P&O Cruises | — | 47.8% |
| Royal Caribbean | — | 48.2% |
| Fred. Olsen | — | 13.1% |
| Ambassador Cruise Line | — | 13.3% |
Virgin Voyages currently has the highest reduction frequency among the 16 cruise lines tracked.
Which cruise lines cut deepest?
Frequency and depth are not the same thing. Some cruise lines reduce prices often but by relatively small amounts.
Cunard
Largest median reduction when a price falls.
Virgin Voyages
Second-largest median drop and the highest reduction frequency.
Disney Cruise Line
Reductions are frequent, but typically shallow.
Inside vs Balcony: which moves more?
The answer depends on whether we mean how often a price changes or how large the reduction is.
Frequency
Balcony: 24.8% have dropped
Inside: 24.5% have dropped
Day-to-day checks also show slightly more Balcony movement, at 18.0% versus 17.8% for Inside.
Size
Inside median drop: 3.9%
Balcony median drop: 3.6%
Balcony prices move slightly more often, but Inside reductions are slightly larger when they occur.
Which departure months are falling most?
December currently stands out for both reduction frequency and depth.
Figures in this section are dated 13 August 2026, not yet re-verified against the most recent data (see note above).
Are prices generally going up or down?
At individual cabin-price level, more comparable prices have increased than decreased.
How large are cruise price drops?
Large reductions happen, but they are not the norm.
| Measure | Over 10% | Over 20% | Over 30% |
|---|---|---|---|
| Individual drops, cabin-level (n=10,023) | 19.3% | 5.9% | 1.7% |
| Per cruise, using largest observed drop (n=4,595) | 23.8% | 8.8% | 3.0% |
How long do price reductions last?
Early CruisePriceSpy data suggests completed reduction episodes are often short-lived, with many lasting only one or two days before the price moves again.
What does this mean for cruisers?
The August data does not support a simple story that cruise prices are broadly falling. At cabin level, more prices have risen than fallen.
What it does show is that meaningful reductions are happening unevenly. Some cruise lines cut far more often than others, some cut deeper, and certain departure months currently show a stronger concentration of reductions.
That is precisely why CruisePriceSpy tracks actual price history rather than relying on advertised savings alone.
Methodology
CruisePriceSpy’s historical tracking began on 15 July 2026. Most figures in this report use data updated on 15 August 2026, except the departure-month and reduction-duration sections, which remain on 13 August 2026 data pending a methodology re-check.
The live dataset contains 13,303 actively tracked cruises across 16 cruise lines and 205,604 historical price observations across tracked cruises and cabin categories.
Cruise-level reduction statistics compare the first price recorded for a cruise with the latest recorded price and identify whether at least one comparable cabin category is now cheaper.
Cabin-level figures pool individual comparable cabin prices across cabin categories. Different cabin categories on the same cruise can move in different directions, so cruise-level and cabin-level percentages are not expected to match exactly.
Duration analysis includes completed reduction episodes only, meaning a price was observed to fall and later change again. Ongoing reductions are excluded from the completed-duration calculation until an end point is observed.
For a full explanation of how CruisePriceSpy tracks prices and defines a price drop site-wide, see How CruisePriceSpy Works.
Building a longer-term picture of cruise price movements
This is the first edition of CruisePriceSpy’s UK Cruise Price Report, based on the daily pricing data collected since our tracking system began.
As our historical dataset continues to grow, future reports will provide an increasingly detailed view of cruise price movements, including how reductions occur, how long they last, and how pricing behaviour differs between cruise lines, destinations and cabin categories.
The figures in this report represent changes measured against CruisePriceSpy’s first recorded prices for comparable tracked cruises. They are designed to show real observed price movements from our growing dataset.
Cruise lines covered
Royal Caribbean, Cunard, Virgin Voyages, P&O Cruises, MSC Cruises, Princess Cruises, Celebrity Cruises, Norwegian Cruise Line, Holland America Line, Oceania Cruises, Ambassador Cruise Line, Fred. Olsen, Crystal Cruises, Marella Cruises and Azamara Cruises.
Frequently asked questions
Does this report predict future cruise prices?
No. This report analyses historical price movements recorded within the CruisePriceSpy dataset. It does not forecast or guarantee future fares.
What does “below first-recorded price” mean?
It means the most recently recorded price for a cruise is lower than the earliest comparable price CruisePriceSpy captured for that sailing. It does not mean it is the lowest price ever offered or a guaranteed future saving.
How often is this report updated?
CruisePriceSpy publishes a UK Cruise Price Report monthly, drawing on the same daily-tracked dataset used across the site.
What is CruisePriceSpy’s data source?
CruisePriceSpy tracks cruise pricing daily across 16 cruise lines. See How CruisePriceSpy Works for the full methodology.
Using this research
Journalists, publishers, researchers and content creators are welcome to cite findings from this report with clear attribution to CruisePriceSpy.
Suggested attribution: Source: CruisePriceSpy.com